SK Hynix, Samsung Electronics, and Micron make almost all of the world's advanced memory. They sell into the same AI cycle, chase the same HBM orders, and report earnings that rise and fall together. To an investor they look like natural peers.
Then you try to compare their "ADR premium," and the comparison falls apart. The reason is structural, not financial: only one of the three has the two legs a U.S. ADR premium needs.
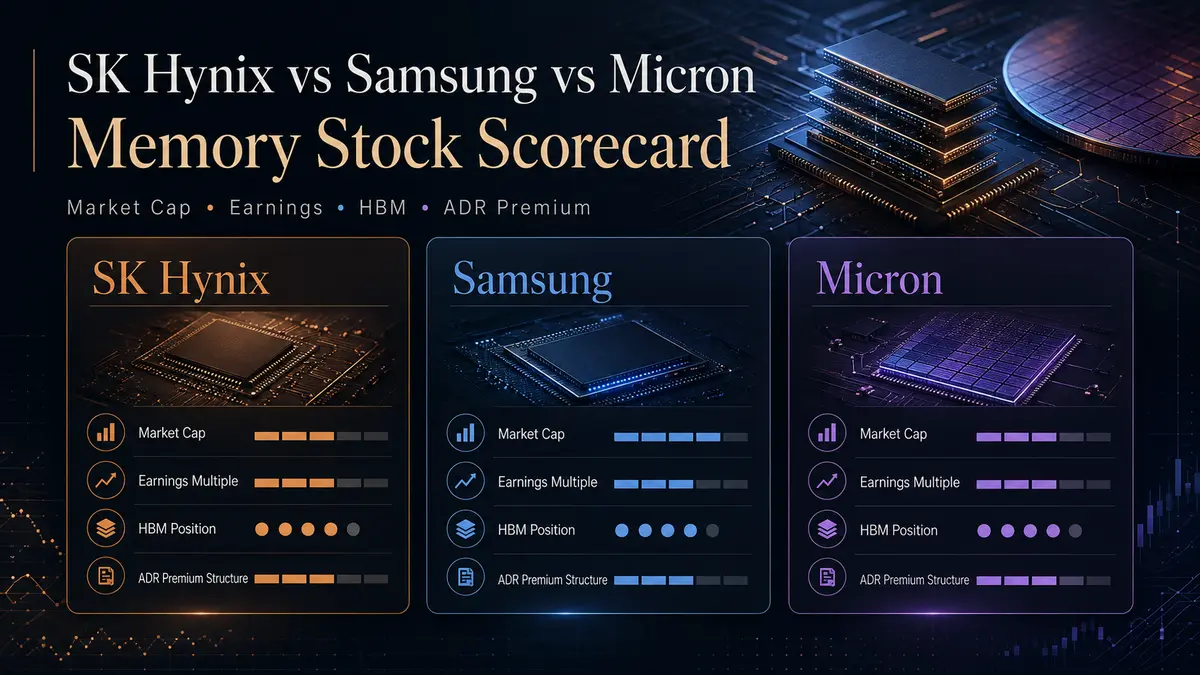
The scorecard below lines them up on market value, earnings, HBM position, and valuation, then on the listing structure that decides whether a U.S. ADR premium can even exist for each stock.
The scorecard at a glance
| SK Hynix | Samsung Electronics | Micron | |
|---|---|---|---|
| Primary listing | KRX: 000660 (Seoul, KRW) | KRX: 005930 (Seoul, KRW) | Nasdaq: MU (US, USD) |
| U.S. market access | Nasdaq: SKHY ADR (listed Jul 10, 2026)[1][2] | OTC only: SSNLF (foreign ordinary shares, illiquid)[3] | MU is the U.S. listing (US-domiciled, HQ Boise, Idaho)[4] |
| Depositary receipt | 1 ADS = 1/10 ordinary share[2] | No U.S. ADR; London GDR (SMSN = 25 common shares)[3] | n/a: single class, single listing |
| FY2025 revenue | KRW 97.15T (~$69B)[5] | KRW 333.6T (~$236B)[6] | ~$37.4B (FY ended Aug 28, 2025)[7] |
| FY2025 net income | KRW 42.95T (~$30B)[5] | KRW 45.2T (~$32B)[6] | ~$8.5B[7] |
| HBM position | #1: ~58% HBM revenue share, Q1 2026[17] | #2: ~21%, Q1 2026[17] | #3: ~21%, Q1 2026[17] |
| Approx. market cap (year-end 2025) | ~$287B[12] | ~$542B[13] | ~$321B[14] |
| FY2025 earnings multiple (approx.) | ~10×[5] | ~17×[6] | ~37×[7] |
| U.S. ADR premium? | Yes: a live, measurable spread vs KRX:000660 | No U.S. ADR: nothing to quote (a London GDR exists) | No: impossible by definition |
The earnings-multiple row is illustrative: year-end 2025 market cap divided by FY2025 net income. It is not a standardized same-date trailing P/E.
A few things in that table deserve a closer look before we draw conclusions.
Reading the numbers: HBM position and earnings
On the underlying business, the three are not equal, and the gap is mostly HBM.
SK Hynix led the HBM3E cycle, and the disclosures show it. The company said HBM was more than 40% of its DRAM revenue in the fourth quarter of 2024,[9] and Counterpoint Research estimated it held about 70% of the global HBM market by revenue in the first quarter of 2025. That was enough to put SK Hynix ahead of Samsung in total DRAM revenue for the first time, at 36% to Samsung's 34%.[8] Full-year 2025 followed through: revenue of KRW 97.15 trillion, operating profit of KRW 47.21 trillion, and HBM revenue that more than doubled year on year.[5]
Samsung is larger overall. Its FY2025 revenue of KRW 333.6 trillion dwarfs SK Hynix's, but Samsung is a conglomerate, and memory is only one piece alongside phones, displays, and foundry. Consolidated revenue is not an apples-to-apples memory comparison.[6] What's telling is what Samsung leaves out: its Q3 2025 release did not separately disclose HBM revenue, even as HBM3E sales drove a record memory quarter.[10]
Micron is the easiest of the three to read, because it reports in dollars on a single listing. Its HBM revenue crossed $1 billion in fiscal Q2 2025,[11] and the full fiscal year (ended August 28, 2025) brought roughly $37.4 billion in revenue and $8.5 billion in net income.[7] Real, but a fraction of the Korean leaders' memory scale.
Reading the numbers: market cap and an illustrative earnings multiple
Market value and valuation are where a scorecard has to be honest about what it can and cannot say.
Using one aggregator's year-end 2025 snapshot so the three are comparable, market capitalization ran roughly $287 billion for SK Hynix, $542 billion for Samsung, and $321 billion for Micron.[12][13][14] These move every day. Treat them as scale, not as a quote. To keep the comparison aligned with FY2025 results, the scorecard uses year-end 2025 market capitalizations.
A clean P/E is hard to produce here, for reasons that matter more than the exact number. Memory earnings are deeply cyclical. A P/E computed at the bottom of a down-cycle, when earnings are near zero, looks astronomical; the same stock a year later looks cheap. And the three are on different fiscal calendars. SK Hynix and Samsung report calendar years; Micron's fiscal year ends in late August. A standardized same-date trailing P/E would need aligned reporting dates, which these three do not share.
What the table shows instead is an illustrative FY2025 earnings multiple: each company's year-end 2025 market cap divided by its FY2025 net income. On that basis SK Hynix sits near 10×, Samsung near 17× (using profit attributable to shareholders, about KRW 44.3 trillion), and Micron near 37×, because its fiscal-2025 earnings were still early in the HBM ramp.[5][6][7] These are not quoted trailing P/Es. They are a rough, same-method comparison, useful as a cycle-position indicator rather than a ranking.
The real question: why SK Hynix has a U.S. ADR premium and Micron doesn't
This is the part a scorecard gets wrong most often, and it has nothing to do with which company is "better." It is pure market structure.
A U.S. ADR (American Depositary Receipt) premium is the gap between a U.S.-listed depositary share and the currency-adjusted price of the same company's home-market ordinary shares. Read that definition carefully: a U.S. ADR premium needs two legs, a U.S. ADR and a separate home-market listing to compare it against. Each of these three companies supplies a different number of legs.
SK Hynix has two, so it has a premium. Its Korean ordinary shares trade in Seoul as 000660, priced in won. Its U.S. depositary shares trade on Nasdaq as SKHY, where one ADS is worth one-tenth of a Korean ordinary share.[2] Because both legs trade independently, you can convert one into the other (SKHY price × USD/KRW × 10, against the 000660 price) and measure the gap. That gap is the SKHY ADR premium, and it is a real number. In SKHY's first two weeks the matched-close premium ranged from about 15.8% to 51.1%.[16] You can see where it sits today on the calculator and the premium-history page.
Micron has one leg, so a premium is impossible. Micron is a U.S. company, headquartered in Boise, Idaho, and listed on Nasdaq under MU.[4] Its ordinary shares are the U.S. listing. There is no second, foreign market trading "the same" Micron shares at a different price, so there is nothing to compute a premium against. Ask "what is Micron's ADR premium?" and the honest answer is: the question does not apply. Micron is the home market. It cannot be at a premium to itself.
That is also why Micron is the wrong benchmark if your real question is "what should the SKHY premium be?" A useful ADR benchmark is another company that has a U.S. ADR sitting on top of a foreign ordinary. TSMC (TSM over Taipei-listed 2330) is the textbook case, and we put SKHY next to it here. Micron teaches a different lesson: it shows what "no premium" looks like, which is just a company whose primary listing is already in the market and currency you are buying.
Why Samsung sits in between
Samsung is the case that rewards a careful read, because the easy assumption, that a big Korean chip company must have a U.S. ADR like SK Hynix, is wrong.
Samsung Electronics' primary listing is KRX: 005930 in Seoul, and it has no U.S.-listed ADR program at all. The U.S. ticker SSNLF is not an ADR; it is an over-the-counter quotation of Samsung's actual Korean ordinary shares, thinly traded. Samsung does run a Global Depositary Receipt program on the London Stock Exchange under SMSN, where one GDR represents 25 common shares. So a depositary-receipt premium or discount can exist for Samsung against London, but that is a GDR premium, not a U.S. ADR premium, and it is not what an SKHY-style calculator measures.[3]
So on the U.S. ADR premium axis the three still line up cleanly. SK Hynix has a U.S. ADR and a Korean ordinary, so it has a measurable U.S. premium. Samsung has Korean ordinaries, a London GDR, and an OTC ordinary line, but no U.S. ADR, so there is no U.S. ADR premium to quote. And Micron is the U.S. listing itself. If Samsung ever launched a sponsored U.S. ADR, something reported as under consideration now and then, it would gain that specific structure and a U.S. premium of its own. Until then, a U.S.-ADR-premium number for Samsung simply does not exist.
What this means for investors
The payoff of separating the business from the listing is three habits.
1. Don't confuse HBM leadership with the premium
SK Hynix's HBM lead changes what the business is worth. It does not, by itself, say whether SKHY should trade at a bigger or smaller premium to 000660. Both legs reflect the same HBM fundamentals. The premium moves for mechanical reasons instead: the ADS ratio, USD/KRW, non-overlapping trading hours, investor access, liquidity, and the supply of depositary shares. We unpack those drivers in the premium explainer.
2. Pick the right comparison for the right question
If you want to value the business, compare SK Hynix, Samsung, and Micron on HBM share, revenue, margins, and capital intensity. That is the scorecard above. If you want to understand the U.S. ADR premium, compare SKHY to another foreign-ordinary-plus-U.S.-ADR pair like TSMC, not to Micron. Micron is a peer on fundamentals and a non-comparable on premium mechanics.
3. Watch which leg moves the spread
A widening SKHY premium can mean the ADR rallied, the Korean share fell, the won weakened, or some mix. The methodology page shows the parity calculation, and premium history tells you whether the move is coming from New York or Seoul.
Frequently asked questions
Does Micron have an ADR premium?
No. Micron (MU) is a U.S.-domiciled company whose primary listing is already on Nasdaq. An ADR premium measures a U.S. depositary share against a separate home-market listing; with no second leg, there is nothing to measure. "Zero premium" here means the concept does not apply, not that Micron is fairly priced.[4]
Why does SKHY trade at a premium to the Korean share?
Because SKHY (one-tenth of a Korean ordinary share per ADS) and 000660 trade independently in different time zones and currencies, with conversion friction, different investor bases, and limited depositary supply. Those structural frictions prevent the two prices from instantly converging.[2] The premium is an informational comparison, not an executable trade.
Is Samsung's SSNLF the same as SKHY?
No. SKHY is a sponsored ADR on Nasdaq with a published one-tenth-share ratio and real liquidity.[2] SSNLF is not an ADR at all; it is an over-the-counter quotation of Samsung's Korean ordinary shares, thinly traded, and Samsung has no U.S. ADR program (it uses London-listed GDRs instead). So there is no U.S. ADR premium for Samsung to measure.[3]
Which is the best memory stock?
This article does not rank them as investments. The scorecard is informational. SK Hynix leads on HBM share today, Samsung is far larger overall, and Micron is the only one of the three listed purely in the U.S. and a real third HBM supplier. Which is "best" depends on your objectives, your risk tolerance, and where we are in the cycle. This comparison does not settle that.
Why are the P/E numbers so different across websites?
Because memory earnings are cyclical and the three use different fiscal years, a trailing P/E depends heavily on the date, the source, and whether it is trailing or forward. Treat any single P/E as a cycle-position indicator rather than a ranking.
Bottom line
SK Hynix, Samsung, and Micron are real peers on the memory business, and SK Hynix is the HBM leader, with about 58% of global HBM market revenue in Q1 2026 per Counterpoint Research (down from a roughly 70% peak in Q1 2025) and HBM more than doubling through 2025.[17][5] But on the question of a U.S. ADR premium, only one of them can have one. SK Hynix has a Korean ordinary share and a U.S. ADR, so it has a measurable premium. Samsung has no U.S. ADR, only a London GDR and an OTC ordinary line, so a U.S. ADR premium does not apply. And Micron is the U.S. listing, so the idea of a premium does not apply either. The scorecard's most useful column is the last one. It tells you that a U.S. ADR premium is a property of how a stock is listed, not of how well its memory business is doing.
References
- Nasdaq Newsroom, Global Innovation Meets Global Capital: SK hynix Lists on Nasdaq, July 10, 2026.
- SK hynix Inc., Final Prospectus, SEC EDGAR, July 9, 2026. One-tenth-share ADS ratio and depositary arrangements.
- OTC Markets, Samsung Electronics Co., Ltd. (SSNLF), which OTC Markets lists as "Ordinary Shares" rather than an ADR. Samsung Electronics IR, Listing Information, and London Stock Exchange, SMSN (GDR, each representing 25 common shares): Samsung has London-listed GDRs and no U.S. ADR program.
- Micron Technology, Inc., Annual Report on Form 10-K for the fiscal year ended August 28, 2025, SEC EDGAR. U.S.-domiciled, headquartered in Boise, Idaho; Nasdaq: MU.
- SK hynix, SK hynix Announces FY25 Financial Results, January 28, 2026. Revenue KRW 97.1467T, operating profit KRW 47.2063T, net profit KRW 42.9479T; HBM revenue more than doubled year on year.
- Samsung Electronics, Samsung Electronics Announces Fourth Quarter and FY 2025 Results, January 2026 (consolidated revenue KRW 333.6T, operating profit KRW 43.6T). Net profit KRW 45.2068T, of which KRW 44.2610T attributable to owners, per Samsung's consolidated statements of income (Samsung IR, Audited Financial Statements).
- Micron Technology, Inc., Fourth Quarter and Full Year Fiscal 2025 Press Release (Exhibit 99.1), SEC EDGAR, September 23, 2025. Full year (ended August 28, 2025) revenue $37.378B; net income attributable to Micron $8.539B.
- Counterpoint Research, SK Hynix Takes Top Spot For First Time on Continued HBM Demand, April 2025. SK Hynix led DRAM revenue with 36% share vs Samsung's 34% in Q1 2025, and held roughly 70% of the HBM market by revenue.
- SK hynix, SK hynix Announces 4Q24 Financial Results, January 2025. HBM accounted for over 40% of total DRAM revenue in the fourth quarter of 2024.
- Samsung Electronics, Samsung Electronics Announces Third Quarter 2025 Results, October 30, 2025. Record memory quarterly revenue on HBM3E sales; HBM revenue not separately disclosed in the release.
- Micron Technology, Inc., Micron Reports Results for the Second Quarter Fiscal 2025, March 2025. HBM revenue crosses $1 billion milestone.
- Companies Market Cap, SK Hynix market capitalization history. Year-end 2025 ~$286.61B.
- Companies Market Cap, Samsung Electronics market capitalization history. Year-end 2025 ~$542.11B.
- Companies Market Cap, Micron Technology market capitalization history. Year-end 2025 ~$320.53B.
- TrendForce News, Samsung HBM4 Reportedly to Ship First After Lunar New Year, Initial Share Projected at Mid-20%, February 9, 2026. Provisional HBM4 allocation (citing Hankyung and industry sources): SK hynix mid-50%, Samsung mid-20%, Micron ~20%.
- SKHY Premium, SKHY ADR: The First Two Weeks — Premium Patterns, Volume & What to Watch, July 27, 2026. Matched-close premium 15.8%–51.1% across the first 11 sessions.
- Counterpoint Research, Global DRAM and HBM Market Share (live quarterly tracker). Most recent reading shown here: Q1 2026 HBM revenue share of SK hynix 58%, Samsung 21%, Micron 21%. The page updates each quarter, so the latest figures may differ from those quoted in the table.